|
FY2011 House 2 |
FY2011 House 2 Revised |
FY2011 House Final |
FY2011 Senate Final |
FY2011 GAA |
|
|---|---|---|---|---|---|
| Budget Tracking | 41,557,508 | 41,557,508 | 41,297,772 | 41,945,776 | 40,297,772 |
|
FY2008 GAA |
FY2009 GAA |
FY2010 GAA |
FY2010 Projected |
FY2011 GAA |
|
|---|---|---|---|---|---|
| Historical Budget Levels | 23,305,308 | 26,091,714 | 46,558,361 | 44,900,777 | 40,297,772 |
* GAA is General Appropriation Act.
| SPENDING CATEGORY |
FY2007 Expended |
FY2008 Expended |
FY2009 Expended |
FY2010 Projected |
FY2011 GAA |
|---|---|---|---|---|---|
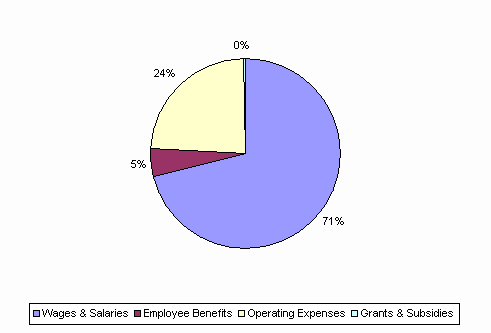
| Wages & Salaries | 17,249 | 18,742 | 18,610 | 31,393 | 28,670 |
| Employee Benefits | 790 | 896 | 851 | 1,912 | 1,873 |
| Operating Expenses | 3,712 | 3,327 | 3,934 | 11,475 | 9,635 |
| Grants & Subsidies | 665 | 800 | 0 | 120 | 120 |
| TOTAL | 22,416 | 23,765 | 23,395 | 44,901 | 40,298 |
FY2011 Spending Category Chart
