|
FY2011 House 2 |
FY2011 House 2 Revised |
FY2011 House Final |
FY2011 Senate Final |
FY2011 GAA |
|
|---|---|---|---|---|---|
| Budget Tracking | 12,439,952 | 12,439,952 | 12,394,681 | 12,439,952 | 12,359,681 |
|
FY2008 GAA |
FY2009 GAA |
FY2010 GAA |
FY2010 Projected |
FY2011 GAA |
|
|---|---|---|---|---|---|
| Historical Budget Levels | 5,170,000 | 4,303,025 | 13,060,407 | 12,988,394 | 12,359,681 |
* GAA is General Appropriation Act.
| SPENDING CATEGORY |
FY2007 Expended |
FY2008 Expended |
FY2009 Expended |
FY2010 Projected |
FY2011 GAA |
|---|---|---|---|---|---|
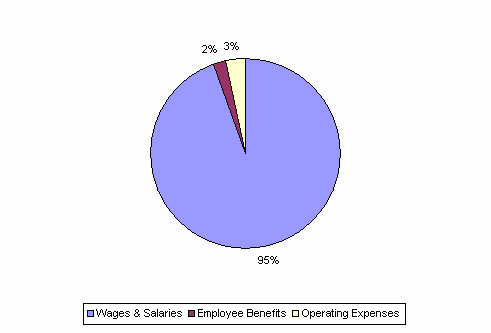
| Wages & Salaries | 950 | 2,728 | 3,608 | 12,207 | 11,656 |
| Employee Benefits | 34 | 36 | 70 | 296 | 295 |
| Operating Expenses | 491 | 2,043 | 230 | 485 | 408 |
| Grants & Subsidies | 250 | 102 | 0 | 0 | 0 |
| TOTAL | 1,725 | 4,909 | 3,909 | 12,988 | 12,360 |
FY2011 Spending Category Chart
