|
FY2011 House 2 |
FY2011 House 2 Revised |
FY2011 House Final |
FY2011 Senate Final |
FY2011 GAA |
|
|---|---|---|---|---|---|
| Budget Tracking | 4,520,130 | 4,520,130 | 4,513,132 | 4,520,130 | 4,446,132 |
|
FY2008 GAA |
FY2009 GAA |
FY2010 GAA |
FY2010 Projected |
FY2011 GAA |
|
|---|---|---|---|---|---|
| Historical Budget Levels | 4,942,183 | 5,506,927 | 4,683,708 | 4,537,623 | 4,446,132 |
* GAA is General Appropriation Act.
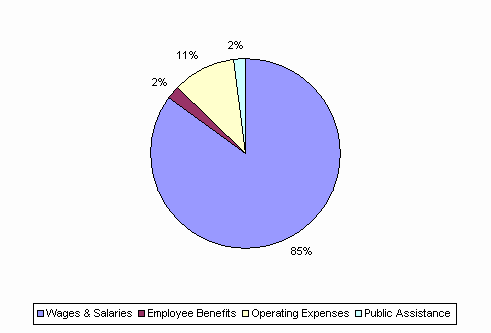
| SPENDING CATEGORY |
FY2007 Expended |
FY2008 Expended |
FY2009 Expended |
FY2010 Projected |
FY2011 GAA |
|---|---|---|---|---|---|
| Wages & Salaries | 3,270 | 3,525 | 3,760 | 3,808 | 3,777 |
| Employee Benefits | 146 | 154 | 130 | 127 | 107 |
| Operating Expenses | 1,688 | 998 | 626 | 513 | 472 |
| Public Assistance | 90 | 130 | 90 | 90 | 90 |
| Grants & Subsidies | 490 | 455 | 125 | 0 | 0 |
| TOTAL | 5,684 | 5,262 | 4,732 | 4,538 | 4,446 |
FY2011 Spending Category Chart