|
FY2011 House 2 |
FY2011 House 2 Revised |
FY2011 House Final |
FY2011 Senate Final |
FY2011 GAA |
|
|---|---|---|---|---|---|
| Budget Tracking | 4,500,133 | 4,500,133 | 4,387,891 | 4,450,133 | 4,387,891 |
|
FY2008 GAA |
FY2009 GAA |
FY2010 GAA |
FY2010 Projected |
FY2011 GAA |
|
|---|---|---|---|---|---|
| Historical Budget Levels | 4,966,481 | 5,700,068 | 4,720,397 | 4,522,821 | 4,387,891 |
* GAA is General Appropriation Act.
| SPENDING CATEGORY |
FY2007 Expended |
FY2008 Expended |
FY2009 Expended |
FY2010 Projected |
FY2011 GAA |
|---|---|---|---|---|---|
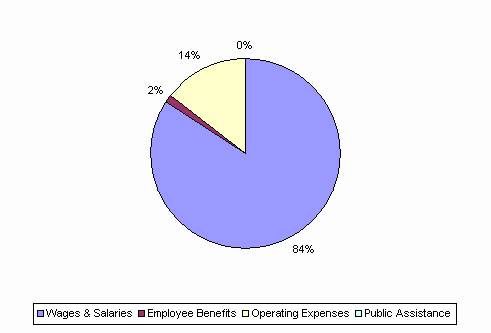
| Wages & Salaries | 3,507 | 3,780 | 4,043 | 3,825 | 3,691 |
| Employee Benefits | 86 | 105 | 113 | 69 | 69 |
| Operating Expenses | 1,122 | 838 | 833 | 625 | 625 |
| Public Assistance | 3 | 0 | 4 | 4 | 3 |
| Grants & Subsidies | 374 | 240 | 60 | 0 | 0 |
| TOTAL | 5,091 | 4,963 | 5,054 | 4,523 | 4,388 |
FY2011 Spending Category Chart
