|
FY2011 House 2 |
FY2011 House 2 Revised |
FY2011 House Final |
FY2011 Senate Final |
FY2011 GAA |
|
|---|---|---|---|---|---|
| Budget Tracking | 1,572,433 | 1,572,433 | 1,464,896 | 1,464,896 | 1,464,896 |
|
FY2008 GAA |
FY2009 GAA |
FY2010 GAA |
FY2010 Projected |
FY2011 GAA |
|
|---|---|---|---|---|---|
| Historical Budget Levels | 1,628,664 | 1,674,347 | 1,576,198 | 1,574,143 | 1,464,896 |
* GAA is General Appropriation Act.
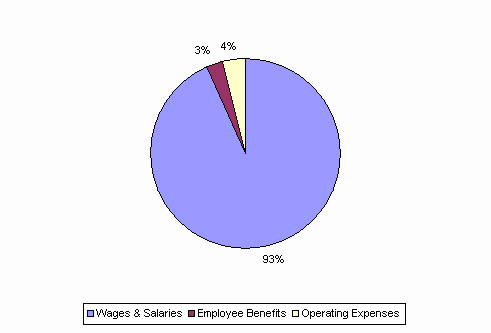
| SPENDING CATEGORY |
FY2007 Expended |
FY2008 Expended |
FY2009 Expended |
FY2010 Projected |
FY2011 GAA |
|---|---|---|---|---|---|
| Wages & Salaries | 1,463 | 1,513 | 1,537 | 1,477 | 1,368 |
| Employee Benefits | 29 | 33 | 39 | 40 | 40 |
| Operating Expenses | 57 | 52 | 38 | 57 | 57 |
| TOTAL | 1,548 | 1,599 | 1,614 | 1,574 | 1,465 |
FY2011 Spending Category Chart