|
FY2011 House 2 |
FY2011 House 2 Revised |
FY2011 House Final |
FY2011 Senate Final |
FY2011 GAA |
|
|---|---|---|---|---|---|
| Budget Tracking | 26,583,531 | 26,583,531 | 26,044,797 | 26,446,561 | 25,714,271 |
|
FY2008 GAA |
FY2009 GAA |
FY2010 GAA |
FY2010 Projected |
FY2011 GAA |
|
|---|---|---|---|---|---|
| Historical Budget Levels | 34,791,004 | 36,272,524 | 29,637,373 | 28,220,126 | 25,714,271 |
* GAA is General Appropriation Act.
| SPENDING CATEGORY |
FY2007 Expended |
FY2008 Expended |
FY2009 Expended |
FY2010 Projected |
FY2011 GAA |
|---|---|---|---|---|---|
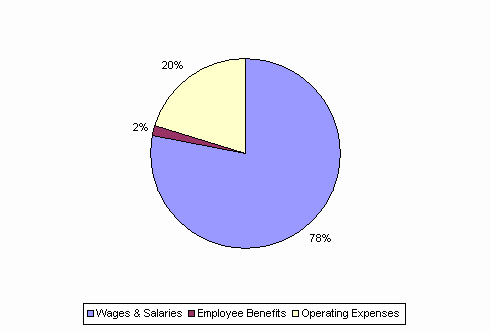
| Wages & Salaries | 24,123 | 25,485 | 24,588 | 21,574 | 20,085 |
| Employee Benefits | 510 | 509 | 463 | 408 | 390 |
| Operating Expenses | 7,542 | 7,983 | 8,321 | 6,238 | 5,239 |
| Grants & Subsidies | 2,280 | 608 | 0 | 0 | 0 |
| TOTAL | 34,455 | 34,584 | 33,372 | 28,220 | 25,714 |
FY2011 Spending Category Chart
