|
FY2011 House 2 |
FY2011 House 2 Revised |
FY2011 House Final |
FY2011 Senate Final |
FY2011 GAA |
|
|---|---|---|---|---|---|
| Budget Tracking | 6,086,178 | 6,086,178 | 5,825,202 | 6,136,178 | 5,751,276 |
|
FY2008 GAA |
FY2009 GAA |
FY2010 GAA |
FY2010 Projected |
FY2011 GAA |
|
|---|---|---|---|---|---|
| Historical Budget Levels | 7,200,741 | 7,773,765 | 6,382,555 | 6,045,516 | 5,751,276 |
* GAA is General Appropriation Act.
| SPENDING CATEGORY |
FY2007 Expended |
FY2008 Expended |
FY2009 Expended |
FY2010 Projected |
FY2011 GAA |
|---|---|---|---|---|---|
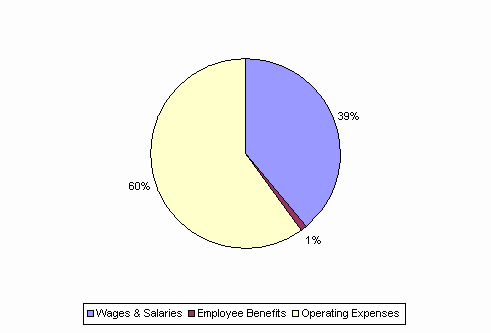
| Wages & Salaries | 2,503 | 2,855 | 2,847 | 2,594 | 2,237 |
| Employee Benefits | 56 | 62 | 61 | 67 | 61 |
| Operating Expenses | 3,747 | 3,849 | 3,817 | 3,385 | 3,453 |
| Grants & Subsidies | 904 | 750 | 38 | 0 | 0 |
| TOTAL | 7,210 | 7,516 | 6,763 | 6,046 | 5,751 |
FY2011 Spending Category Chart
