|
FY2011 House 2 |
FY2011 House 2 Revised |
FY2011 House Final |
FY2011 Senate Final |
FY2011 GAA |
|
|---|---|---|---|---|---|
| Budget Tracking | 36,693,379 | 36,693,379 | 39,516,409 | 36,693,379 | 36,227,715 |
|
FY2008 GAA |
FY2009 GAA |
FY2010 GAA |
FY2010 Projected |
FY2011 GAA |
|
|---|---|---|---|---|---|
| Historical Budget Levels | 50,513,466 | 52,012,766 | 40,530,864 | 40,322,061 | 36,227,715 |
* GAA is General Appropriation Act.
| SPENDING CATEGORY |
FY2007 Expended |
FY2008 Expended |
FY2009 Expended |
FY2010 Projected |
FY2011 GAA |
|---|---|---|---|---|---|
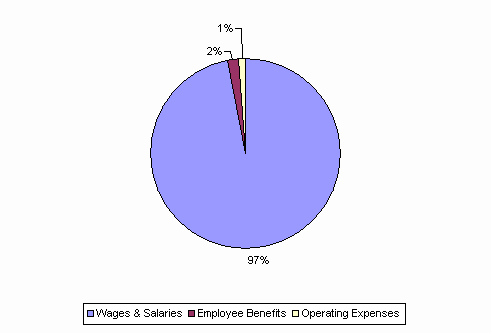
| Wages & Salaries | 37,309 | 39,837 | 39,381 | 34,492 | 35,110 |
| Employee Benefits | 783 | 784 | 848 | 810 | 714 |
| Operating Expenses | 12,272 | 11,120 | 8,114 | 5,020 | 404 |
| TOTAL | 50,364 | 51,740 | 48,342 | 40,322 | 36,228 |
FY2011 Spending Category Chart
