|
FY2011 House 2 |
FY2011 House 2 Revised |
FY2011 House Final |
FY2011 Senate Final |
FY2011 GAA |
|
|---|---|---|---|---|---|
| Budget Tracking | 79,438,970 | 79,438,970 | 79,281,172 | 85,076,776 | 80,469,544 |
|
FY2008 GAA |
FY2009 GAA |
FY2010 GAA |
FY2010 Projected |
FY2011 GAA |
|
|---|---|---|---|---|---|
| Historical Budget Levels | 116,017,360 | 119,073,397 | 88,539,813 | 82,409,813 | 80,469,544 |
* GAA is General Appropriation Act.
| SPENDING CATEGORY |
FY2007 Expended |
FY2008 Expended |
FY2009 Expended |
FY2010 Projected |
FY2011 GAA |
|---|---|---|---|---|---|
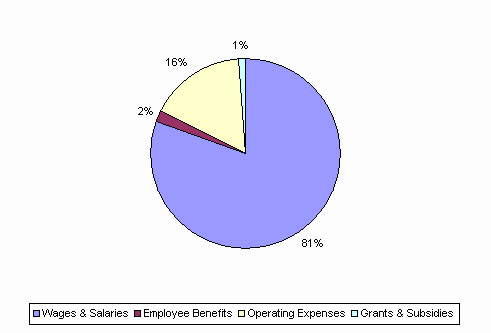
| Wages & Salaries | 89,187 | 89,273 | 86,124 | 68,410 | 64,727 |
| Employee Benefits | 2,331 | 2,294 | 2,329 | 1,990 | 1,713 |
| Operating Expenses | 29,910 | 25,092 | 24,489 | 12,010 | 13,029 |
| Grants & Subsidies | 0 | 75 | 0 | 0 | 1,000 |
| TOTAL | 121,427 | 116,734 | 112,941 | 82,410 | 80,470 |
FY2011 Spending Category Chart
