|
FY2011 House 2 |
FY2011 House 2 Revised |
FY2011 House Final |
FY2011 Senate Final |
FY2011 GAA |
|
|---|---|---|---|---|---|
| Budget Tracking | 1,731,122 | 1,731,122 | 1,731,122 | 1,731,123 | 1,731,122 |
|
FY2008 GAA |
FY2009 GAA |
FY2010 GAA |
FY2010 Projected |
FY2011 GAA |
|
|---|---|---|---|---|---|
| Historical Budget Levels | 1,617,734 | 1,782,433 | 1,731,123 | 1,731,123 | 1,731,122 |
* GAA is General Appropriation Act.
| SPENDING CATEGORY |
FY2007 Expended |
FY2008 Expended |
FY2009 Expended |
FY2010 Projected |
FY2011 GAA |
|---|---|---|---|---|---|
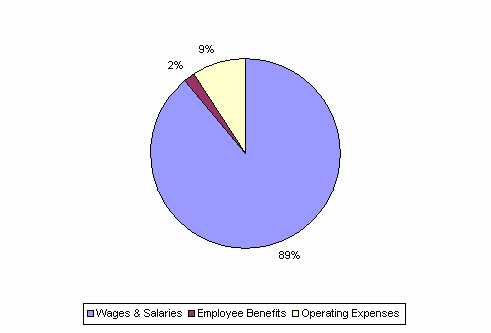
| Wages & Salaries | 1,411 | 1,373 | 1,465 | 1,542 | 1,539 |
| Employee Benefits | 30 | 28 | 26 | 29 | 33 |
| Operating Expenses | 113 | 227 | 187 | 160 | 160 |
| TOTAL | 1,554 | 1,629 | 1,678 | 1,731 | 1,731 |
FY2011 Spending Category Chart
