|
FY2011 House 2 |
FY2011 House 2 Revised |
FY2011 House Final |
FY2011 Senate Final |
FY2011 GAA |
|
|---|---|---|---|---|---|
| Budget Tracking | 1,540,486 | 1,540,486 | 1,539,942 | 1,540,486 | 1,539,942 |
|
FY2008 GAA |
FY2009 GAA |
FY2010 GAA |
FY2010 Projected |
FY2011 GAA |
|
|---|---|---|---|---|---|
| Historical Budget Levels | 1,394,032 | 1,664,942 | 1,539,942 | 1,412,945 | 1,539,942 |
* GAA is General Appropriation Act.
| SPENDING CATEGORY |
FY2007 Expended |
FY2008 Expended |
FY2009 Expended |
FY2010 Projected |
FY2011 GAA |
|---|---|---|---|---|---|
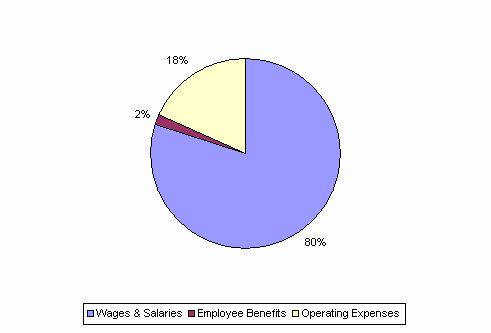
| Wages & Salaries | 1,195 | 1,073 | 1,136 | 1,116 | 1,233 |
| Employee Benefits | 21 | 21 | 19 | 26 | 26 |
| Operating Expenses | 84 | 258 | 316 | 272 | 281 |
| TOTAL | 1,300 | 1,352 | 1,471 | 1,413 | 1,540 |
FY2011 Spending Category Chart
