|
FY2011 House 2 |
FY2011 House 2 Revised |
FY2011 House Final |
FY2011 Senate Final |
FY2011 GAA |
|
|---|---|---|---|---|---|
| Budget Tracking | 3,380,426 | 3,380,426 | 2,931,484 | 3,121,902 | 2,931,484 |
|
FY2008 GAA |
FY2009 GAA |
FY2010 GAA |
FY2010 Projected |
FY2011 GAA |
|
|---|---|---|---|---|---|
| Historical Budget Levels | 3,558,786 | 3,576,934 | 3,133,588 | 3,166,909 | 2,931,484 |
* GAA is General Appropriation Act.
| SPENDING CATEGORY |
FY2007 Expended |
FY2008 Expended |
FY2009 Expended |
FY2010 Projected |
FY2011 GAA |
|---|---|---|---|---|---|
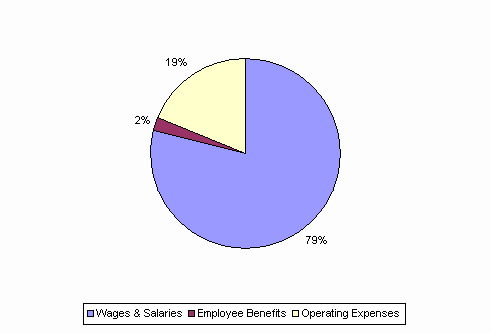
| Wages & Salaries | 2,443 | 2,601 | 2,809 | 2,517 | 2,309 |
| Employee Benefits | 64 | 62 | 61 | 62 | 72 |
| Operating Expenses | 490 | 791 | 599 | 587 | 550 |
| Grants & Subsidies | 0 | 30 | 0 | 0 | 0 |
| TOTAL | 2,997 | 3,484 | 3,469 | 3,167 | 2,931 |
FY2011 Spending Category Chart
