|
FY2011 House 2 |
FY2011 House 2 Revised |
FY2011 House Final |
FY2011 Senate Final |
FY2011 GAA |
|
|---|---|---|---|---|---|
| Budget Tracking | 22,787,339 | 22,787,339 | 22,721,716 | 22,705,260 | 22,705,260 |
|
FY2008 GAA |
FY2009 GAA |
FY2010 GAA |
FY2010 Projected |
FY2011 GAA |
|
|---|---|---|---|---|---|
| Historical Budget Levels | 26,585,871 | 27,410,277 | 23,452,981 | 22,934,606 | 22,705,260 |
* GAA is General Appropriation Act.
| SPENDING CATEGORY |
FY2007 Expended |
FY2008 Expended |
FY2009 Expended |
FY2010 Projected |
FY2011 GAA |
|---|---|---|---|---|---|
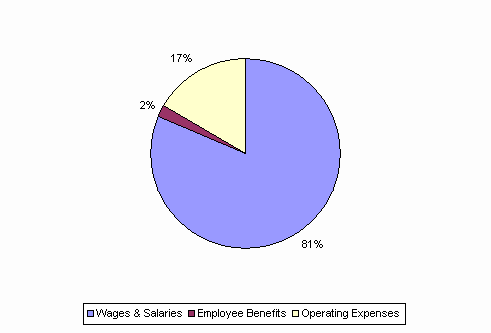
| Wages & Salaries | 17,891 | 19,933 | 20,941 | 18,439 | 18,492 |
| Employee Benefits | 435 | 472 | 460 | 408 | 407 |
| Operating Expenses | 2,590 | 4,826 | 4,486 | 4,087 | 3,806 |
| Grants & Subsidies | 1,439 | 1,318 | 1,420 | 0 | 0 |
| TOTAL | 22,354 | 26,549 | 27,307 | 22,935 | 22,705 |
FY2011 Spending Category Chart
