|
FY2011 House 2 |
FY2011 House 2 Revised |
FY2011 House Final |
FY2011 Senate Final |
FY2011 GAA |
|
|---|---|---|---|---|---|
| Budget Tracking | 1,812,419 | 1,812,419 | 1,812,420 | 1,812,420 | 1,812,420 |
|
FY2008 GAA |
FY2009 GAA |
FY2010 GAA |
FY2010 Projected |
FY2011 GAA |
|
|---|---|---|---|---|---|
| Historical Budget Levels | 1,852,697 | 1,928,775 | 1,647,654 | 1,573,516 | 1,812,420 |
* GAA is General Appropriation Act.
| SPENDING CATEGORY |
FY2007 Expended |
FY2008 Expended |
FY2009 Expended |
FY2010 Projected |
FY2011 GAA |
|---|---|---|---|---|---|
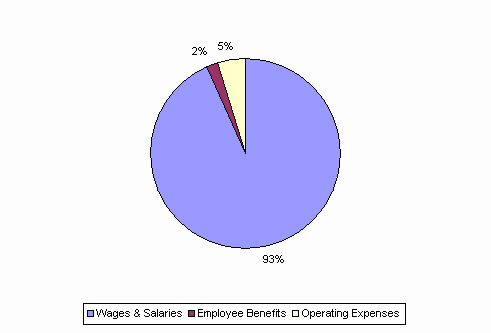
| Wages & Salaries | 1,555 | 1,774 | 1,743 | 1,462 | 1,694 |
| Employee Benefits | 25 | 27 | 28 | 26 | 31 |
| Operating Expenses | 49 | 50 | 80 | 85 | 88 |
| TOTAL | 1,629 | 1,852 | 1,851 | 1,574 | 1,812 |
FY2011 Spending Category Chart
