|
FY2011 House 2 |
FY2011 House 2 Revised |
FY2011 House Final |
FY2011 Senate Final |
FY2011 GAA |
|
|---|---|---|---|---|---|
| Budget Tracking | 6,401,407 | 6,401,407 | 6,098,766 | 0 | 6,098,766 |
|
FY2008 GAA |
FY2009 GAA |
FY2010 GAA |
FY2010 Projected |
FY2011 GAA |
|
|---|---|---|---|---|---|
| Historical Budget Levels | 12,268,059 | 12,658,827 | 9,692,945 | 9,692,945 | 6,098,766 |
* GAA is General Appropriation Act.
| SPENDING CATEGORY |
FY2007 Expended |
FY2008 Expended |
FY2009 Expended |
FY2010 Projected |
FY2011 GAA |
|---|---|---|---|---|---|
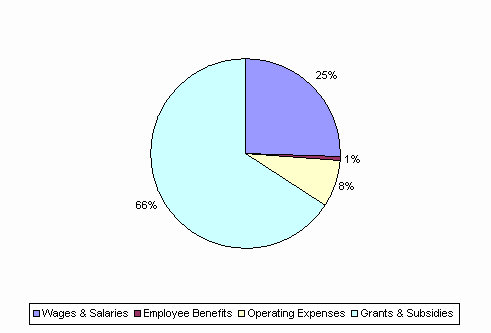
| Wages & Salaries | 1,762 | 2,027 | 2,221 | 1,654 | 1,551 |
| Employee Benefits | 50 | 76 | 72 | 53 | 45 |
| Operating Expenses | 460 | 615 | 572 | 546 | 479 |
| Grants & Subsidies | 6,401 | 9,422 | 9,907 | 7,441 | 4,023 |
| TOTAL | 8,674 | 12,140 | 12,773 | 9,693 | 6,099 |
FY2011 Spending Category Chart
