|
FY2011 House 2 |
FY2011 House 2 Revised |
FY2011 House Final |
FY2011 Senate Final |
FY2011 GAA |
|
|---|---|---|---|---|---|
| Budget Tracking | 700,719 | 700,719 | 672,325 | 690,110 | 672,325 |
|
FY2008 GAA |
FY2009 GAA |
FY2010 GAA |
FY2010 Projected |
FY2011 GAA |
|
|---|---|---|---|---|---|
| Historical Budget Levels | 796,380 | 863,722 | 726,432 | 726,432 | 672,325 |
* GAA is General Appropriation Act.
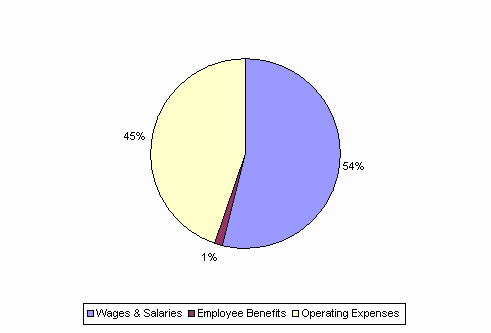
| SPENDING CATEGORY |
FY2007 Expended |
FY2008 Expended |
FY2009 Expended |
FY2010 Projected |
FY2011 GAA |
|---|---|---|---|---|---|
| Wages & Salaries | 414 | 459 | 449 | 382 | 362 |
| Employee Benefits | 7 | 11 | 7 | 9 | 9 |
| Operating Expenses | 368 | 333 | 396 | 335 | 301 |
| TOTAL | 789 | 803 | 852 | 726 | 672 |
FY2011 Spending Category Chart
