|
FY2011 House 2 |
FY2011 House 2 Revised |
FY2011 House Final |
FY2011 Senate Final |
FY2011 GAA |
|
|---|---|---|---|---|---|
| Budget Tracking | 3,034,656 | 3,034,656 | 2,963,930 | 2,972,085 | 2,963,930 |
|
FY2008 GAA |
FY2009 GAA |
FY2010 GAA |
FY2010 Projected |
FY2011 GAA |
|
|---|---|---|---|---|---|
| Historical Budget Levels | 3,631,756 | 3,719,768 | 3,128,511 | 3,128,511 | 2,963,930 |
* GAA is General Appropriation Act.
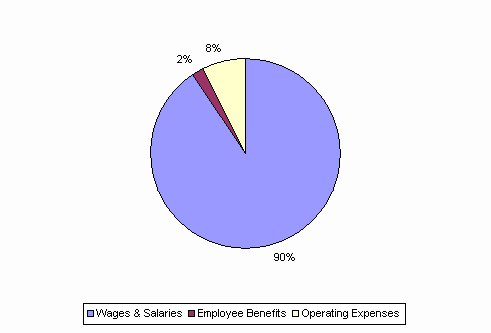
| SPENDING CATEGORY |
FY2007 Expended |
FY2008 Expended |
FY2009 Expended |
FY2010 Projected |
FY2011 GAA |
|---|---|---|---|---|---|
| Wages & Salaries | 2,904 | 2,918 | 2,909 | 2,828 | 2,686 |
| Employee Benefits | 49 | 54 | 58 | 56 | 54 |
| Operating Expenses | 636 | 727 | 546 | 245 | 224 |
| TOTAL | 3,589 | 3,699 | 3,513 | 3,129 | 2,964 |
FY2011 Spending Category Chart