|
FY2011 House 2 |
FY2011 House 2 Revised |
FY2011 House Final |
FY2011 Senate Final |
FY2011 GAA |
|
|---|---|---|---|---|---|
| Budget Tracking | 3,445,389 | 3,445,389 | 3,445,390 | 3,445,389 | 3,410,935 |
|
FY2008 GAA |
FY2009 GAA |
FY2010 GAA |
FY2010 Projected |
FY2011 GAA |
|
|---|---|---|---|---|---|
| Historical Budget Levels | 3,644,512 | 3,763,148 | 3,445,389 | 3,445,389 | 3,410,935 |
* GAA is General Appropriation Act.
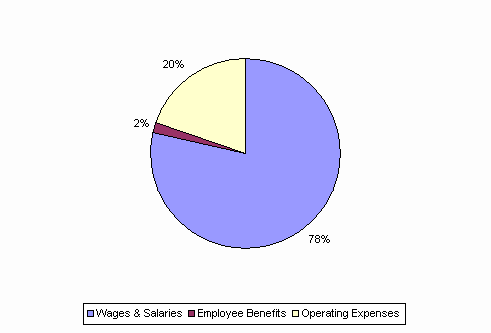
| SPENDING CATEGORY |
FY2007 Expended |
FY2008 Expended |
FY2009 Expended |
FY2010 Projected |
FY2011 GAA |
|---|---|---|---|---|---|
| Wages & Salaries | 2,913 | 3,018 | 2,949 | 2,793 | 2,685 |
| Employee Benefits | 63 | 62 | 53 | 56 | 53 |
| Operating Expenses | 488 | 609 | 667 | 597 | 672 |
| TOTAL | 3,465 | 3,689 | 3,669 | 3,445 | 3,411 |
FY2011 Spending Category Chart