|
FY2011 House 2 |
FY2011 House 2 Revised |
FY2011 House Final |
FY2011 Senate Final |
FY2011 GAA |
|
|---|---|---|---|---|---|
| Budget Tracking | 0 | 0 | 23,404,762 | 24,005,668 | 21,509,937 |
|
FY2008 GAA |
FY2009 GAA |
FY2010 GAA |
FY2010 Projected |
FY2011 GAA |
|
|---|---|---|---|---|---|
| Historical Budget Levels | 6,392,000 | 7,776,254 | 23,404,762 | 23,704,762 | 21,509,937 |
* GAA is General Appropriation Act.
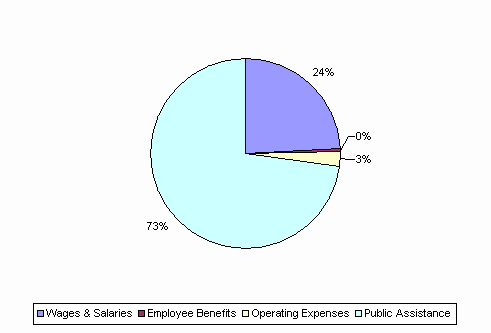
| SPENDING CATEGORY |
FY2007 Expended |
FY2008 Expended |
FY2009 Expended |
FY2010 Projected |
FY2011 GAA |
|---|---|---|---|---|---|
| Wages & Salaries | 4,882 | 5,373 | 5,760 | 6,098 | 5,210 |
| Employee Benefits | 40 | 35 | 123 | 128 | 90 |
| Operating Expenses | 833 | 561 | 1,031 | 618 | 571 |
| Public Assistance | 0 | 0 | 0 | 16,861 | 15,639 |
| TOTAL | 5,755 | 5,968 | 6,915 | 23,705 | 21,510 |
FY2011 Spending Category Chart