|
FY2011 House 2 |
FY2011 House 2 Revised |
FY2011 House Final |
FY2011 Senate Final |
FY2011 GAA |
|
|---|---|---|---|---|---|
| Budget Tracking | 0 | 0 | 13,701,396 | 10,024,667 | 9,063,812 |
|
FY2008 GAA |
FY2009 GAA |
FY2010 GAA |
FY2010 Projected |
FY2011 GAA |
|
|---|---|---|---|---|---|
| Historical Budget Levels | 895,237 | 929,438 | 10,462,218 | 14,585,046 | 9,063,812 |
* GAA is General Appropriation Act.
| SPENDING CATEGORY |
FY2007 Expended |
FY2008 Expended |
FY2009 Expended |
FY2010 Projected |
FY2011 GAA |
|---|---|---|---|---|---|
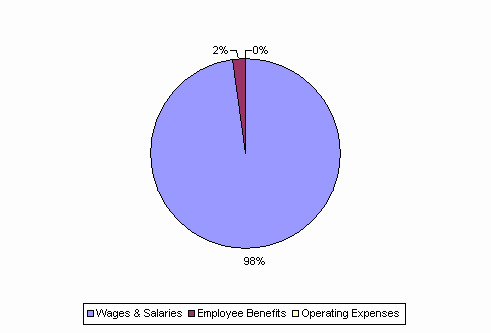
| Wages & Salaries | 901 | 957 | 842 | 14,387 | 8,862 |
| Employee Benefits | 0 | 0 | 10 | 199 | 199 |
| Operating Expenses | 35 | 27 | 50 | 0 | 3 |
| TOTAL | 935 | 984 | 902 | 14,585 | 9,064 |
FY2011 Spending Category Chart
