|
FY2011 House 2 |
FY2011 House 2 Revised |
FY2011 House Final |
FY2011 Senate Final |
FY2011 GAA |
|
|---|---|---|---|---|---|
| Budget Tracking | 0 | 0 | 2,651,701 | 2,127,067 | 2,044,860 |
|
FY2008 GAA |
FY2009 GAA |
FY2010 GAA |
FY2010 Projected |
FY2011 GAA |
|
|---|---|---|---|---|---|
| Historical Budget Levels | 2,386,331 | 2,479,415 | 2,214,118 | 2,901,711 | 2,044,860 |
* GAA is General Appropriation Act.
| SPENDING CATEGORY |
FY2007 Expended |
FY2008 Expended |
FY2009 Expended |
FY2010 Projected |
FY2011 GAA |
|---|---|---|---|---|---|
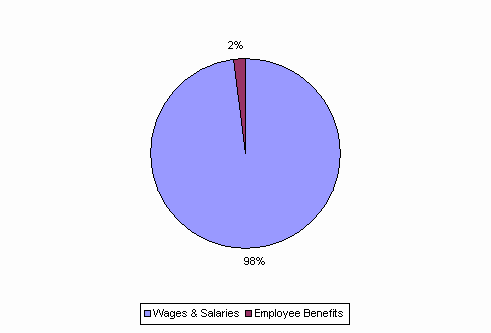
| Wages & Salaries | 2,550 | 2,489 | 2,309 | 2,855 | 2,005 |
| Employee Benefits | 0 | 0 | 30 | 39 | 39 |
| Operating Expenses | 126 | 135 | 135 | 7 | 0 |
| TOTAL | 2,677 | 2,624 | 2,474 | 2,902 | 2,045 |
FY2011 Spending Category Chart
