|
FY2011 House 2 |
FY2011 House 2 Revised |
FY2011 House Final |
FY2011 Senate Final |
FY2011 GAA |
|
|---|---|---|---|---|---|
| Budget Tracking | 0 | 0 | 27,533,582 | 20,845,577 | 19,982,869 |
|
FY2008 GAA |
FY2009 GAA |
FY2010 GAA |
FY2010 Projected |
FY2011 GAA |
|
|---|---|---|---|---|---|
| Historical Budget Levels | 6,248,393 | 6,474,623 | 21,740,332 | 29,825,167 | 19,982,869 |
* GAA is General Appropriation Act.
| SPENDING CATEGORY |
FY2007 Expended |
FY2008 Expended |
FY2009 Expended |
FY2010 Projected |
FY2011 GAA |
|---|---|---|---|---|---|
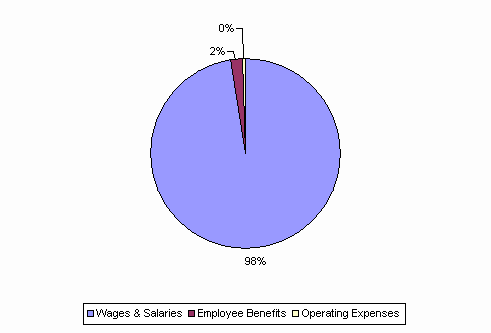
| Wages & Salaries | 6,258 | 7,406 | 8,693 | 29,324 | 19,487 |
| Employee Benefits | 0 | 0 | 114 | 405 | 399 |
| Operating Expenses | 141 | 147 | 112 | 96 | 96 |
| TOTAL | 6,399 | 7,553 | 8,919 | 29,825 | 19,983 |
FY2011 Spending Category Chart
