|
FY2011 House 2 |
FY2011 House 2 Revised |
FY2011 House Final |
FY2011 Senate Final |
FY2011 GAA |
|
|---|---|---|---|---|---|
| Budget Tracking | 346,209,732 | 346,209,732 | 186,677,225 | 188,247,375 | 188,247,375 |
|
FY2008 GAA |
FY2009 GAA |
FY2010 GAA |
FY2010 Projected |
FY2011 GAA |
|
|---|---|---|---|---|---|
| Historical Budget Levels | 134,412,460 | 135,665,342 | 190,422,288 | 197,285,293 | 188,247,375 |
* GAA is General Appropriation Act.
| SPENDING CATEGORY |
FY2007 Expended |
FY2008 Expended |
FY2009 Expended |
FY2010 Projected |
FY2011 GAA |
|---|---|---|---|---|---|
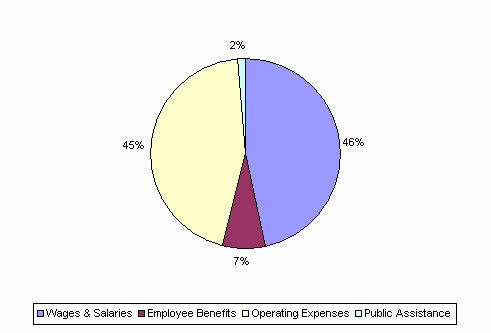
| Wages & Salaries | 35,549 | 38,100 | 39,126 | 98,636 | 88,022 |
| Employee Benefits | 16,620 | 16,836 | 11,624 | 13,120 | 13,181 |
| Operating Expenses | 78,402 | 82,447 | 82,879 | 82,657 | 84,173 |
| Public Assistance | 2,908 | 2,777 | 2,773 | 2,872 | 2,872 |
| TOTAL | 133,479 | 140,161 | 136,402 | 197,285 | 188,247 |
FY2011 Spending Category Chart
