|
FY2011 House 2 |
FY2011 House 2 Revised |
FY2011 House Final |
FY2011 Senate Final |
FY2011 GAA |
|
|---|---|---|---|---|---|
| Budget Tracking | 63,044,673 | 63,044,673 | 32,255,081 | 34,229,553 | 32,255,081 |
|
FY2008 GAA |
FY2009 GAA |
FY2010 GAA |
FY2010 Projected |
FY2011 GAA |
|
|---|---|---|---|---|---|
| Historical Budget Levels | 18,399,624 | 29,294,603 | 28,645,024 | 28,645,024 | 32,255,081 |
* GAA is General Appropriation Act.
| SPENDING CATEGORY |
FY2007 Expended |
FY2008 Expended |
FY2009 Expended |
FY2010 Projected |
FY2011 GAA |
|---|---|---|---|---|---|
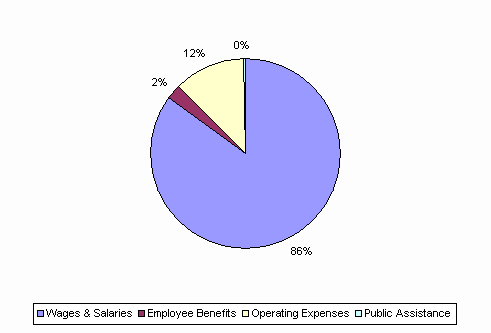
| Wages & Salaries | 12,721 | 14,939 | 23,829 | 24,322 | 27,423 |
| Employee Benefits | 342 | 386 | 600 | 580 | 771 |
| Operating Expenses | 3,081 | 2,961 | 4,249 | 3,627 | 3,947 |
| Public Assistance | 830 | 113 | 116 | 116 | 114 |
| TOTAL | 16,974 | 18,399 | 28,794 | 28,645 | 32,255 |
FY2011 Spending Category Chart
