Quick Links
- Statewide Summary
- Judiciary
- Independents
- Administration and Finance
- Energy & Environmental Affairs
- Health and Human Services
- Transportation
- Housing & Economic Development
- Labor & Workforce Development
- Education
- Public Safety
- Legislature
- All Account Listing
- Budget Reductions
- Outside Sections
- Downloads
- Navigation Guide
- Budget Glossary
- Helpful Links
| Account | Description | FY2009 GAA |
FY2009 Total Spending |
|---|---|---|---|
| 4510-0100 | Department of Public Health For the operation of the department; provided, that the department of public health shall report to the joint committee on public health, the joint committee on health care financing, and the house and senate committees on ways and means not later than February 2, 2009, on the impact of increased private and public health insurance coverage, pursuant to chapter 58 of the acts of 2006, and on the utilization and financial needs of public health programs; and provided further, that the report shall include, but not be limited to, the following: (a) an estimate of cost-savings to public health programs generated by increased public and private health insurance coverage in the commonwealth; (b) an assessment of the utilization of public health programs since 2006 including, early intervention services, state laboratory testing services, communicable disease testing services, HIV and AIDS-related services, substance abuse treatment services, family planning services, immunizations, and disease prevention and management services; (c) an assessment of the extent to which health insurance carriers offer benefits coverage for health services provided by public health programs; and (d4) any regulatory, legislative and other recommendations necessary to identify and recoup payment for public health services from liable private insurance carriers and other parties in order to minimize costs to the commonwealth |
21,911,667 | 21,205,853 |
| SPENDING CATEGORY |
FY2005 Expended |
FY2006 Expended |
FY2007 Expended |
FY2008 Expended |
FY2009 GAA |
FY2009 Budget Reductions |
|---|---|---|---|---|---|---|
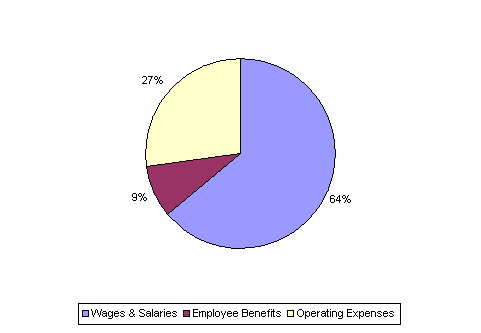
| Wages & Salaries | 7,174 | 7,977 | 7,499 | 7,358 | 14,021 | -723 |
| Employee Benefits | 3,999 | 4,073 | 4,000 | 3,653 | 1,896 | 0 |
| Operating Expenses | 6,643 | 7,772 | 5,858 | 6,127 | 5,994 | 0 |
| Public Assistance | 0 | 0 | 243 | 0 | 0 | 0 |
| TOTAL | 17,815 | 19,822 | 17,601 | 17,137 | 21,912 | -723 |
FY2009 Spending Category Chart
