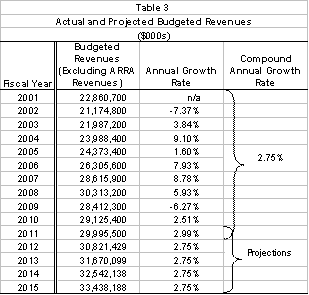
The debt affordability analysis is based on projections of budgeted revenue that will be available to support debt service and other budgetary needs. The budgeted revenue projection for fiscal year 2011 is $29.99 billion. This estimate is based in part on a tax revenue estimate of $19.078 billion, which consists of the consensus tax revenue estimate of $19.05 billion as determined by the Secretary of Administration and Finance and the chairs of the House and Senate Committees on Ways and Means on January 13, 2010, $48 million of additional tax revenue expected as a result of enhanced collection initiatives included in the budget for fiscal year 2011, less $20 million in reduced sales taxes to be collected as a result of the sales tax holiday in August 2010. For purposes of projecting budgeted revenue in future fiscal years, the compound annual growth rate (CAGR) in budgeted revenues from fiscal years 2001 through 2011 of 2.75% was applied to fiscal year 2012 revenues and to each year thereafter. This is consistent with past practice of applying the lesser of (a) the CAGR of historical budgeted revenues, which is 2.75%; and (b) 3%.
To ensure consistency, the budgeted revenue projection for fiscal year 2011 takes into account the same revenues included in the actual budgetary revenue amounts reported in the audited statutory basis financial statements. Specifically, budgeted revenue includes all Commonwealth taxes and other revenues available to pay Commonwealth operating expenses, including debt service, pensions and other budgetary obligations. These budgeted revenue amounts do not include off-budget revenues or tax or toll revenues dedicated to the Massachusetts Department of Transportation, the Massachusetts Bay Transportation Authority, the Massachusetts School Building Authority, and the Massachusetts Convention Center Authority (the debt service obligations of these entities payable from such dedicated revenues have also been excluded from the analysis) or inter-fund transfers from budgeted funds, such as the Stabilization Fund. Any one-time federal stimulus funding received (or expected to be received) pursuant to the American Recovery and Reinvestment Act of 2009 (ARRA) in fiscal years 2009, 2010 and 2011 has been excluded from the calculation of budgeted revenues for purposes of this debt affordability analysis.
Actual and projected budgeted revenues are shown in the table below. The fiscal year 2011-2015 budgeted revenue amounts are projections, as described above.

As a starting point for the analysis of future debt capacity, the following table shows existing debt service and contract assistance payment obligations in fiscal year 2010 and in each of the next five fiscal years as a percentage of the budgeted revenue projection for each of those fiscal years. The existing obligations include the effect of the debt restructuring described above.
| Fiscal Year | Existing Direct Debt Service Including FY11 Restructure | Existing Contract Assistance | Total Existing Obligations | Projected Budgeted Revenue | Debt Service as % of Budgeted Revenue |
|---|---|---|---|---|---|
| 2010 | 1,904,247 | 221,561 | 2,125,808 | 29,125,400 | 7.30% |
| 2011 | 1,677,257 | 224,352 | 1,901,609 | 29,995,500 | 6.34% |
| 2012 | 1,859,480 | 220,227 | 2,079,707 | 30,821,429 | 6.75% |
| 2013 | 1,867,385 | 216,023 | 2,083,408 | 31,670,099 | 6.58% |
| 2014 | 1,779,955 | 216,097 | 1,996,052 | 32,542,138 | 6.13% |
| 2015 | 1,719,588 | 216,218 | 1,935,806 | 33,438,188 | 5.79% |