Quick Links
- Home
- aBudget Summary by Program
- Budget Summary by Account
- All Account Listing
- Veto Listing
- Local Aid - Section 3
- Outside Sections
- Downloads
- Navigation Guide
- Budget Glossary
- Helpful Links
Budget Detail
7061-9408 - Targeted Intervention in Underperforming Schools
Data Current as of: 9/11/2013
|
FY2014 House 1 |
FY2014 House Final |
FY2014 Senate Final |
FY2014 GAA |
|
|---|---|---|---|---|
| Budget Tracking | 9,755,007 | 7,677,989 | 7,890,268 | 7,890,268 |
|
FY2011 GAA |
FY2012 GAA |
FY2013 GAA |
FY2013 Projected |
FY2014 GAA |
|
|---|---|---|---|---|---|
| Historical Budget Levels | 6,740,746 | 6,740,746 | 7,667,618 | 9,112,636 | 7,890,268 |
* GAA is General Appropriation Act.
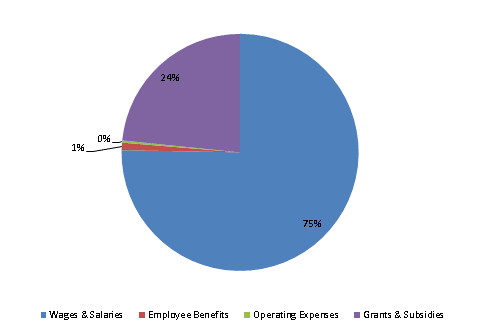
| SPENDING CATEGORY |
FY2010 Expended |
FY2011 Expended |
FY2012 Expended |
FY2013 Projected |
FY2014 GAA |
|---|---|---|---|---|---|
| Wages & Salaries | 4,448 | 6,375 | 4,583 | 6,932 | 5,941 |
| Employee Benefits | 63 | 65 | 81 | 77 | 80 |
| Operating Expenses | 74 | 22 | 44 | 35 | 24 |
| Grants & Subsidies | 2,464 | 961 | 1,180 | 2,068 | 1,845 |
| TOTAL | 7,050 | 7,423 | 5,889 | 9,113 | 7,890 |
FY2014 Spending Category Chart