|
FY2013 House 1 |
FY2013 House Final |
FY2013 Senate Final |
FY2013 GAA |
|
|---|---|---|---|---|
| Budget Tracking | 35,536,672 | 34,536,672 | 35,380,491 | 35,380,491 |
|
FY2010 GAA |
FY2011 GAA |
FY2012 GAA |
FY2012 Projected |
FY2013 GAA |
|
|---|---|---|---|---|---|
| Historical Budget Levels | 40,530,864 | 36,227,715 | 33,676,820 | 33,863,200 | 35,380,491 |
* GAA is General Appropriation Act.
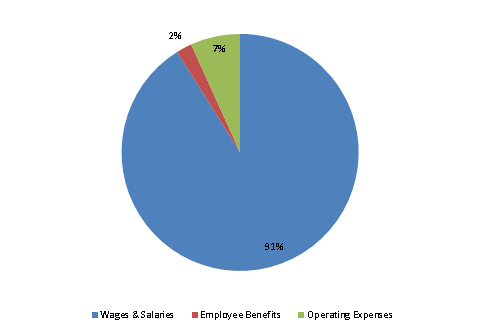
| SPENDING CATEGORY |
FY2009 Expended |
FY2010 Expended |
FY2011 Expended |
FY2012 Projected |
FY2013 GAA |
|---|---|---|---|---|---|
| Wages & Salaries | 39,381 | 34,654 | 35,424 | 33,075 | 32,228 |
| Employee Benefits | 848 | 764 | 837 | 788 | 754 |
| Operating Expenses | 8,114 | 4,750 | 404 | 0 | 2,398 |
| TOTAL | 48,342 | 40,168 | 36,665 | 33,863 | 35,380 |
FY2013 Spending Category Chart