|
FY2011 House 2 |
FY2011 House 2 Revised |
FY2011 House Final |
FY2011 Senate Final |
FY2011 GAA |
|
|---|---|---|---|---|---|
| Budget Tracking | 0 | 0 | 0 | 145,583,697 | 142,989,359 |
|
FY2008 GAA |
FY2009 GAA |
FY2010 GAA |
FY2010 Projected |
FY2011 GAA |
|
|---|---|---|---|---|---|
| Historical Budget Levels | 130,964,744 | 137,437,683 | 144,559,478 | 144,618,366 | 142,989,359 |
* GAA is General Appropriation Act.
| SPENDING CATEGORY |
FY2007 Expended |
FY2008 Expended |
FY2009 Expended |
FY2010 Projected |
FY2011 GAA |
|---|---|---|---|---|---|
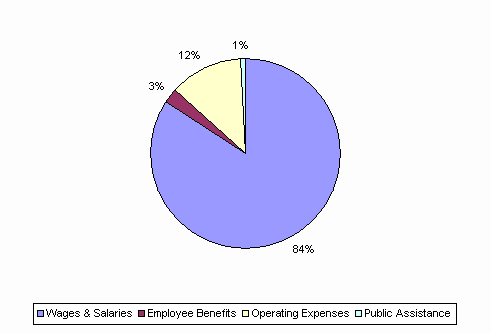
| Wages & Salaries | 112,616 | 118,999 | 118,668 | 123,467 | 120,209 |
| Employee Benefits | 1,454 | 1,211 | 2,763 | 3,143 | 3,733 |
| Operating Expenses | 16,417 | 16,419 | 16,800 | 17,735 | 17,774 |
| Public Assistance | 1,727 | 1,021 | 1,200 | 273 | 1,273 |
| TOTAL | 132,215 | 137,649 | 139,430 | 144,618 | 142,989 |
FY2011 Spending Category Chart
